What a Coach Looks at First in AiM Race Studio 3
The order I open a kart lap in AiM Race Studio 3: GPS speed, RPM, Time Compare, exhaust temperature. And which corner I look at first.

- The order I open things in Race Studio 3: GPS speed, then RPM, then the delta time at the bottom, then exhaust temperature.
- Put the graph on distance, not on time. If my delta is not showing, it is almost always because the plot is on time base.
- AiM calls the delta “Time Compare”. It is the time difference between a reference lap and the other laps you loaded.
- RPM tells you if a speed spike is real. Speed jumping from 92 to 94 km/h with a flat RPM line is the GPS, not the kart.
- I do not go corner by corner any more. I find the three biggest areas of time loss and I start from the biggest one.
- One corner can cost you a lot. At Lonato the same driver was 700 RPM and 3 km/h down in the middle of one double left.
- Data is backward looking. It gives you the real number. The video and the driver tell you why.
- What is AiM Race Studio 3 and what does it show you?
- What do I set up before I read a single channel?
- What is the first channel a coach opens in Race Studio 3?
- Why does RPM come second?
- How do you read Time Compare, the delta, in Race Studio 3?
- What does a real kart lap look like on my Race Studio 3 screen?
- Which corner do I look at first?
- When do I open exhaust temperature and the G channels?
- What can Race Studio 3 not tell you?
- Frequently asked questions
You downloaded the session, Race Studio 3 is open, and there are twenty channels on the left. Where do you actually look first?
I do this every single day, every single session. For my own driving and for the drivers I coach at BabyRace. So I am not going to give you a tour of the software. AiM has a manual for that.
What I can give you is the order. What I open first, what I open second, and what I leave closed until I need it. Because the whole point of opening up data is to understand where you are losing time. Everything else is noise.
What is AiM Race Studio 3 and what does it show you?
Race Studio 3 is AiM’s own software. It is where the data from your MyChron ends up, and where you read it. The version on AiM’s download page today is 3.83.65, dated 30 September 2026.
A few things from AiM’s manual that matter before we start:
- Sessions are saved as .xrk files.
- A profile is made of layouts, and you can apply a profile to any session.
- The layout you will live in is Time-Distance. It draws your channels lap over lap, with distance or time on the X axis.
- The other layouts I touch are Track Map, Scatter and the Split Times Report.
Basically, you build a screen once and you save it. Then every session opens the same way.
On my laptop I have seven or eight profiles. One for lambda, others for other jobs. And GPS speed is in all of them. That already tells you where this is going.
If you have not chosen a logger yet, I compared MyChron 6 vs Alfano 6 in a separate post. This one starts the moment the data is on the laptop.
What do I set up before I read a single channel?
Two things. Two laps, and distance.
First I pick two laps to put on top of each other. One lap alone tells you very little. You need a second one to compare against. It can be your fastest lap against a slower one, a qualifying lap against a race lap, or you against a teammate.
If you are driving alone, with nobody to compare against, you can still do it. Across 15 laps there is one lap where you carried the most speed in a given corner. Put that lap next to your fastest lap and try to match it.
Second, I put the graph on distance. In the Time-Distance layout AiM gives you two options in the toolbar: by distance, with run distance on the X axis, or by time. I want distance. Because I want to see what happened at the same point of the track on both laps, and time base does not line the corners up.
And there is a practical reason too. If my delta is not showing at the bottom, it is probably because I am on time base. I click the stopwatch, I set distance base, and it appears.
That is the whole setup. Now the channels.
What is the first channel a coach opens in Race Studio 3?
GPS speed. Always.
The speed trace is the lap. Where it goes down you are braking or lifting. The bottom of each dip is your minimum speed in the corner. Where it climbs again you are back on the throttle. You can read a whole lap with that one line.
The first thing I look at is the shape of each corner. Is it a V or is it a U?
A V means the driver attacked the entry, stopped the kart too much in the middle, and then had to pick it up again from a low speed. That is overslowing. A U means the speed is carried through the corner. In single speed classes like 60 Mini, juniors, seniors, Rotax or X30, you need the U. You have no gearbox to save you, so you have to keep the RPM up.
And this is why I do not believe in slow in, fast out for karting. You lose two tenths on entry to gain back one and a half on exit. That is still half a tenth lost.
Is GPS speed perfect? No. The GPS can spike. You can also run a speed sensor on the rear axle, and I used that a lot on my KZ to see wheelspin and locking. But 99% of the time I rely on GPS speed.
The only time I skip speed is when I am looking at the chassis. Then I go to the G channels on the track map. I come back to that below.
Why does RPM come second?
Because RPM confirms what the speed is telling me, and it is a smoother line.
To give you an idea of the scale. In a Mini Gr.3 race at Lonato the engine peaked at 14,200 RPM. In the corners it was sitting around 9,000. In the middle of the second hairpin about 8,100. And when the driver locked the tyres it dropped to 7,600.
So RPM does three jobs for me.
It tells me which speed spike is real. If the speed jumps from 92 to 94 km/h and the RPM does not move, that is the GPS. If both move together, something happened on the kart. A kerb, or the rear locking.
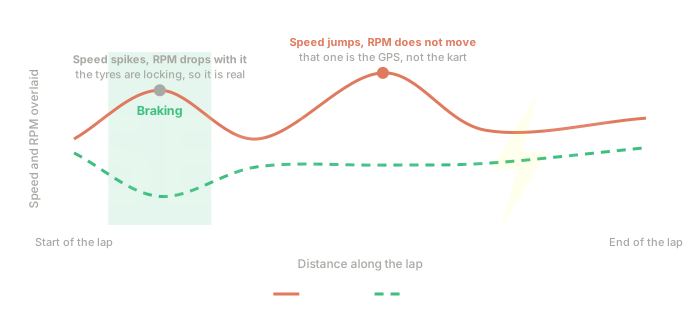
It shows me how hard the driver braked. On one lap the RPM went down to 7,500 on the brakes. On the other it did not. For a beginner that is easier to read than longitudinal G.
It tells me if it is the gearing or the driver. In the double left at Lonato, the same driver was at 10,200 RPM in the final against 10,900 in qualifying. About 700 RPM, which is 3 km/h. One sprocket is worth about 200 RPM, so you would need three teeth. But you cannot gear for one corner. So that one is a driving fix.
How do you read Time Compare, the delta, in Race Studio 3?
Delta time is my religion. It is not really a channel, but it is the third thing on my screen. It sits at the bottom and I like it quite big.
AiM calls it Time Compare. In their manual it is the graph that shows the time difference between a reference lap and the other laps you have loaded. In the Time-Distance layout the best lap is the one indicated by default, and in the settings you can show the trace as “Differential” or as “Gap”, or hide it.
How do I read it? The reference lap is a flat line at zero. The other lap moves around it.
- Where the line is flat, the two laps are doing the same thing.
- Where the line climbs, that lap is losing time right there.
- Where it comes back down, it is gaining.
So I am not looking at the number at the end of the lap. I already know that number, it is the lap time. I am looking for the steps. Each step is a corner, and the size of the step is how much that corner cost.
One warning. The delta is only as good as the distance behind it. The system we used before AiM was Starlane. It is a pretty decent one, but its delta was not accurate, because the driver could be making more metres in a corner and the delta did not see it. Even now I double check the delta against the sector times.
What does a real kart lap look like on my Race Studio 3 screen?
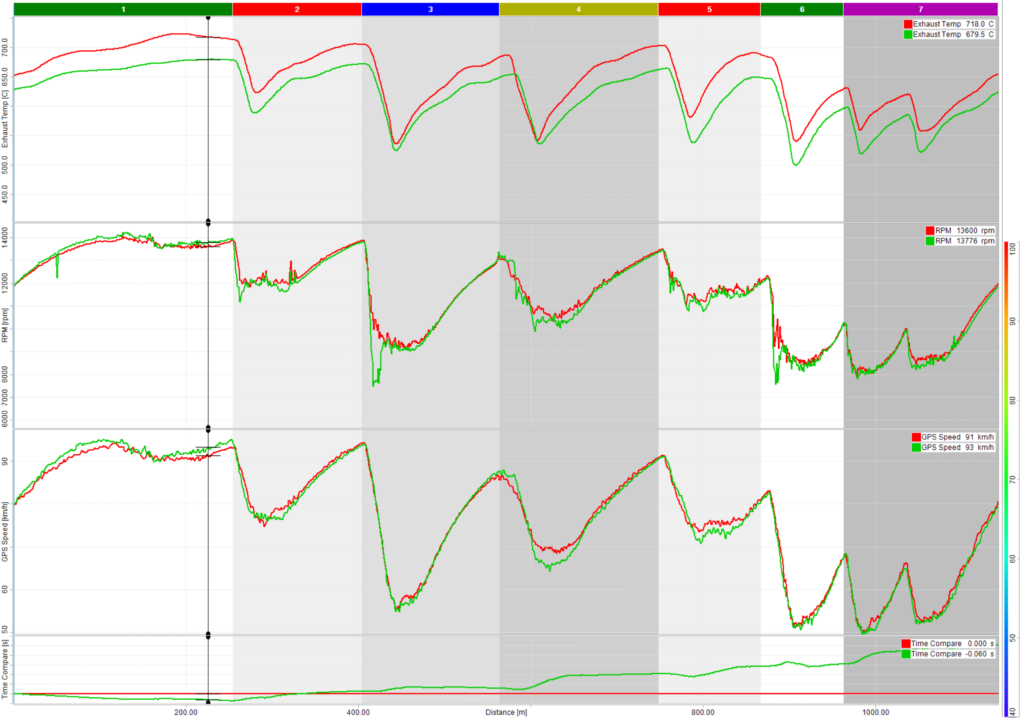
This is my four channel profile, with two real laps on top of each other over distance.
From the top: exhaust temperature, RPM, GPS speed, and Time Compare at the bottom.
On the screen the exhaust temperature is at the top. But my eyes do not go top to bottom. They go like this:
- GPS speed, third panel. I follow the two lines across the lap and look for the corners where one sits under the other.
- RPM, second panel. Same corners. Does the RPM agree? Is that spike real?
- Time Compare, bottom strip. Where are the steps? Which is the biggest?
- Exhaust temperature, top panel. Last, for the engine and for the throttle.
Look at where the cursor is in this capture, on the main straight a bit after 200 metres. The red lap reads 91 km/h and 13,600 RPM. The green lap reads 93 km/h and 13,776 RPM. Time Compare says minus 0.060 seconds, so at that point the green lap is six hundredths ahead.
Then follow the bottom strip to the right. The green line crosses the red one and keeps climbing. All that advantage on the straight is gone, and more.
And this is the trap. If you only look at top speed, you think the green lap is the good one. The delta says the opposite.
Which corner do I look at first?
Not turn one.
I used to do that. Turn one, then turn two, then turn three, in order, all the way around. I do not do it any more, because it is information overload.
Now my procedure is this. I look at the three biggest areas of time loss across the lap, and I always start from the area where the driver is losing the most.
Think about it. If you are six tenths off, do you want to talk about the corner that is worth two or three hundredths? Or the ones that are worth two or three tenths each?
Here is a real case. Same driver at Lonato, a 54.8 in qualifying against a 55.3 in the final. In the double left he was 700 RPM and 3 km/h down in the middle of the corner, and Time Compare showed the loss right there. In the mechanics corner the same driver was only 1 km/h and 100 RPM down.
So where does the debrief start? In the double left. I zoom in there, and then I go back to the speed and the RPM to see why. In that case the final lap was more of a V. He attacked the entry and stopped too much in the middle.
And I keep it to three corners at a time, especially with younger drivers. Fix those, go out, come back, and open the data again.
When do I open exhaust temperature and the G channels?
Exhaust temperature is my fourth channel, and I use it for two different things.
The first one is the engine. Is the carburation too lean or too rich? In that Lonato qualifying the exhaust was around 720 degrees, which was too lean. If the trace looks flat and tells you nothing, fix the scale. In Race Studio 3 the channel settings let you use a custom plotting scale. I bring the maximum down and the minimum up until the curve fills the panel.
The second one is the throttle. At WSK and CIK races in Italy you cannot connect throttle and brake sensors. So how do I see when the driver picks up the throttle? The exhaust temperature rises when you are on the throttle and falls when you are off. In one corner I could see one lap picking up at about 610 metres and the other at 670.
But listen, there is no such a thing as the earlier the better. If you go on the throttle too early you get push understeer. Normally the throttle comes around the apex.
The G channels I open only when the question is the chassis and not the driver. Then I put lateral and longitudinal G on the track map. With two sessions from the same driver at Lonato, I could see on the map that in one of them he was braking a lot more, up to 0.83 g against 0.7. For that kind of question you do not even need the speed.
The full detail on each of these is in the four channels I use in Race Studio 3.
What can Race Studio 3 not tell you?
It cannot tell you why.
Data is backward looking. It shows what already happened, with a precision that your eyes do not have. On the data you can see differences of 30, 40, 50 centimetres in the line.
And data does not lie. A driver comes in and says he has no top speed. Then you open the data and his teammate has even less.
But the reason is somewhere else. The hands, where the eyes are looking, what the kart is doing on entry. That is on the video and in what the driver tells you. So when I have time I do both, the telemetry and the onboard. When there are only 20 or 30 minutes between sessions, sometimes I can only do one.
The other limit is the splits. On the MyChron you get three sectors, and I do not like that. I want to see the track in more sections than that. In PURPL you can have six or seven mini splits, and there is a walkthrough there on how to analyze kart racing data.
- Learn to read it yourself. Start at the karting telemetry guides.
- Read why data doesn’t lie.
- Send me your onboard from a practice day. With an onboard review I go through your laps on video and tell you where the time is.
At the end of the day, racing is more of an art than a science. The data is there to make you a detective about your own driving. It does not drive the kart for you.
Frequently asked questions
Why is my delta time not showing in Race Studio 3?
Probably because the graph is on time base. Click the stopwatch, set it to distance base, and the delta appears at the bottom. In AiM’s manual the trace is called Time Compare, and it can also be hidden in the settings.
Which channel should I look at first in Race Studio 3?
GPS speed. Then RPM, then the delta time, then exhaust temperature. That is the order I use on every session.
What file does Race Studio 3 use?
AiM’s manual says sessions are stored in the .xrk format, which holds more information than the older .drk format.
What is the difference between the best theoretical and the best rolling lap?
Both come from the Split Times Report. According to AiM, the best theoretical is built from the best time of every segment. The best rolling is a lap you really did on track, but not necessarily from the start line to the start line.
Do I need throttle and brake sensors to read a kart lap?
No. I read braking effort from the RPM and throttle pickup from the exhaust temperature. At WSK and CIK races in Italy you cannot connect those sensors anyway.
Send your onboard footage. Alessio reviews it corner-by-corner and tells you exactly what's costing you time, and how to fix it. Back within 48 hours.
Get My Onboard Reviewed → Reviewed personally by a CIK FIA World Champion, never an assistant.I promise I'll not spam you with repurposed shitty AI content but real experiences that only I, Alessio Lorandi, experienced. Written in my funny English-Italian tone of voice 😂
Alessio Lorandi is the former CIK FIA World Junior Champion, winning against Lando Norris in 2013 & F3 multiple race winner. He's helped 200+ karting drivers worldwide get faster & win WSK titles with BabyRace Driver Academy & now through Senndit, his online karting coaching platform.